
PERFORMANCE
MODEL PORTFOLIOS REPORTS
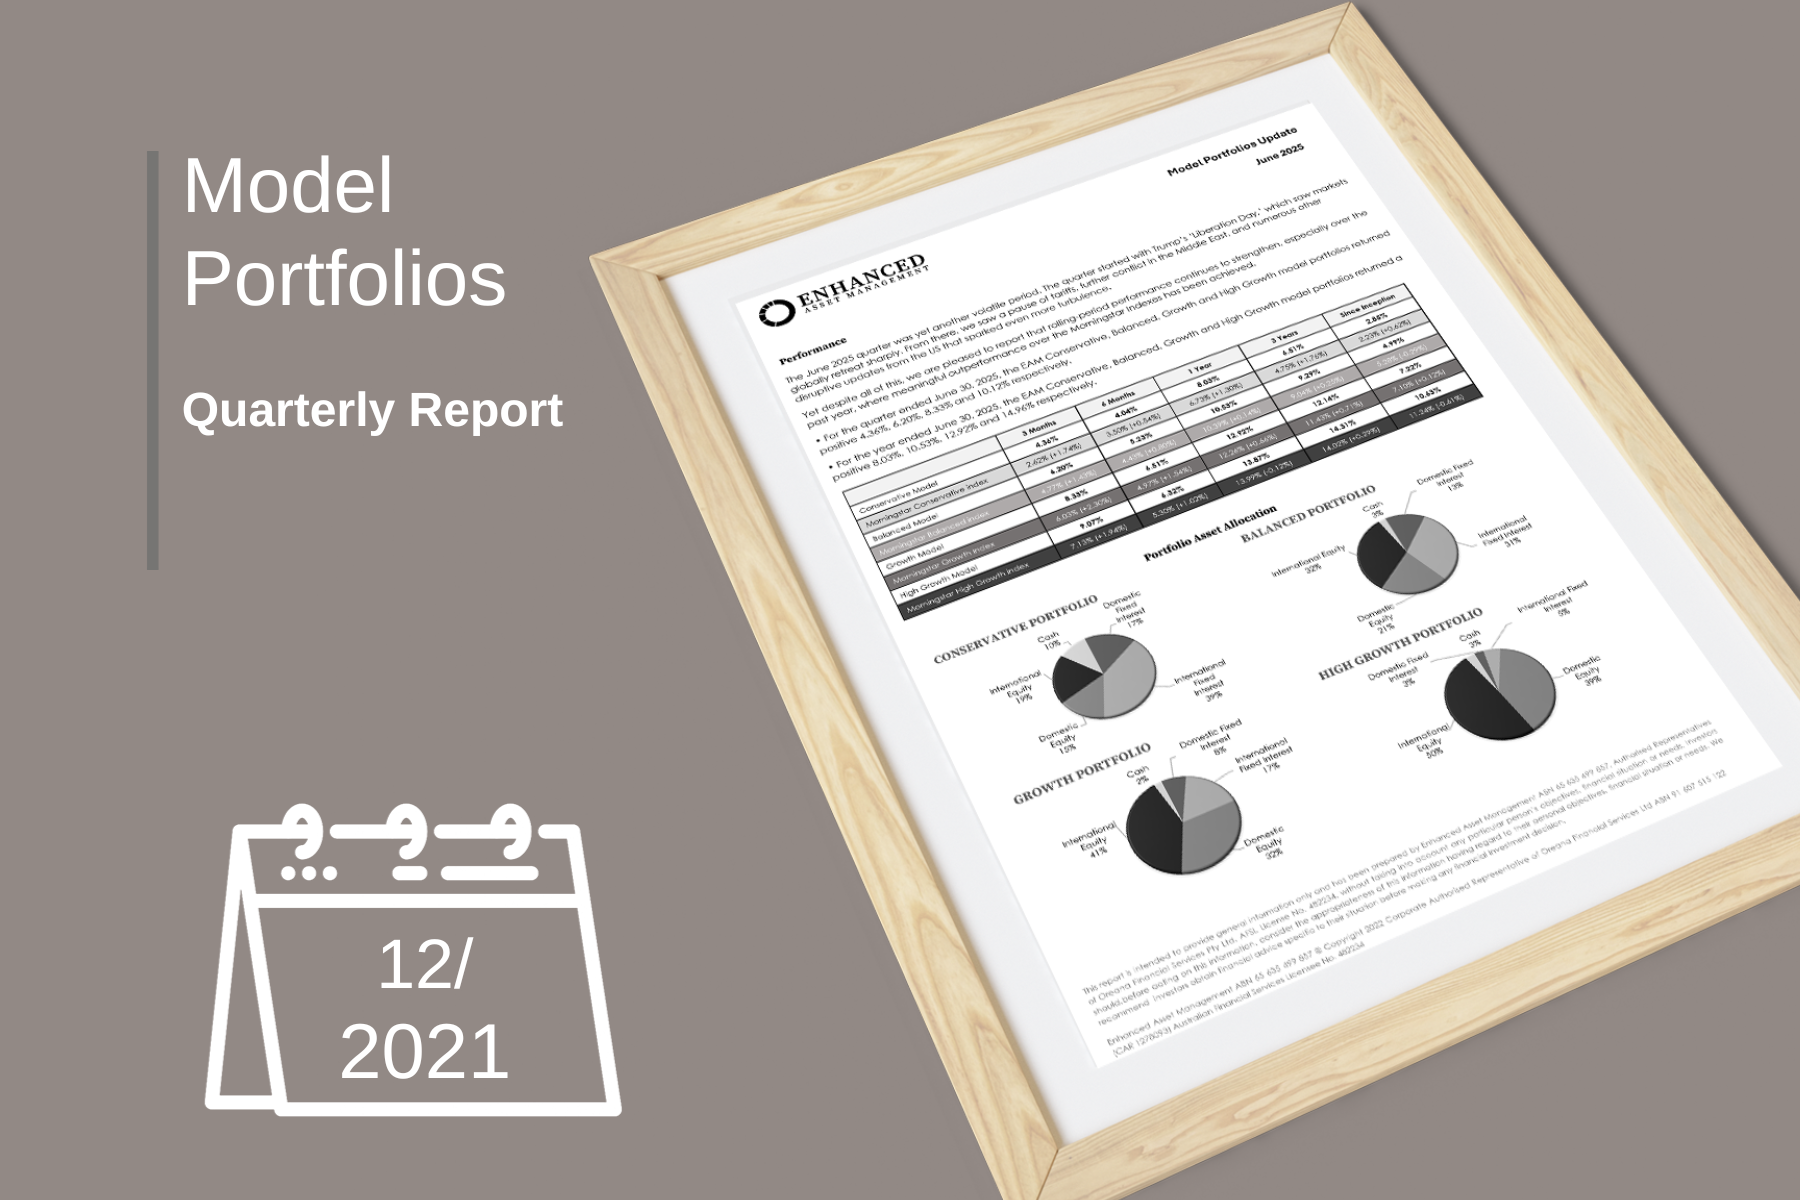
Explore past performance and read the latest Quarterly Reports for Enhanced Asset Management’s Model Portfolios.
| Portfolio and Benchmark | 3 Months | 6 Months | 1 Year | 2 Years | 3 Years | Since Inception# |
|---|---|---|---|---|---|---|
| Conservative Portfolio | 2.86% | 7.34% | 7.19% | 9.80% | 8.33% | 3.26% |
| Balanced Portfolio | 4.18% | 10.64% | 10.54% | 13.42% | 11.65% | 5.51% |
| Growth Portfolio | 5.47% | 14.25% | 14.09% | 16.68% | 14.92% | 7.88% |
| High Growth Portfolio | 6.84% | 16.53% | 16.29% | 19.22% | 17.55% | 11.48% |
* Data as at 30 June 2026
#Inception Dates:
Conservative - 20 July 2020
Balanced - 10 December 2019
Growth - 9 December 2019
High Growth - 4 June 2020
Unless otherwise stated, all performance figures are provided net of fees and are on a pre-tax basis. The information has been prepared for the purpose of providing general information, without taking into account your particular objectives, financial circumstances or needs. You should obtain and consider a copy of the Managed Portfolio Disclosure Document(s) relating to Enhanced Asset Management’s Portfolios before making a decision to invest.
While the information has been prepared with all reasonable care, Enhanced Asset Management (Enhanced) makes no representation or warranty as to the accuracy or completeness of any statement in this information, including any forecasts, nor does Enhanced guarantee the performance of the Portfolios or the repayment of any investor’s capital. To the extent permitted by law, neither Enhanced, including their employees, consultants, advisers, officers or authorised representatives, are liable for any loss or damage arising as a result of reliance placed on the contents of this report. Past performance is not indicative of future performance.
This report was prepared by Enhanced Asset Management (‘Enhanced’). ABN 65 635 499 857. Corporate Authorised Representative of Oreana Financial Services Ltd ABN 91 607 515 122 (CAR 1278093). Australian Financial Services Licensee No. 482234
2025 REPORTS

March 2026

December 2025

September 2025

June 2025

March 2025
2024 REPORTS

December 2024

September 2024

June 2024

March 2024
2023 - 2021 REPORTS

December 2023

September 2023

June 2023

March 2023

December 2022

September 2022

June 2022

March 2022
December 2021

September 2021

June 2021